Georgia’s counties, cities, and businesses are taking bold steps to implement climate solutions that also improve public health, drive economic growth, and build community resilience and a just future. Until now, it’s been difficult to see the full picture.
That’s where the new Drawdown Georgia Solutions Tracker comes in.
Developed by researchers at the Climate and Energy Policy Laboratory at Georgia Tech, this interactive online tool provides county-level data on 16 of the 20 Drawdown Georgia climate solutions, including energy-efficient transportation, large-scale solar, recycling, composting, and more. It’s designed to help local policymakers, planners, advocates, and business leaders identify where solutions are scaling—and where strategic investment could deliver the greatest return.
What the Solutions Tracker Shows

Each dashboard in the Tracker features two interactive maps:
-
The first map shows how prevalent a specific solution—like rooftop solar, heat pumps, or LED lighting—already is across Georgia’s 159 counties. Some solutions may have multiple variables that can be displayed on the map. For example, energy-efficient retrofitting includes data on LED lighting, ceiling insulation, heat pumps, and more that can be viewed by selecting different options from the menu in the upper left of the screen.
-
The second map displays a comparison variable chosen by researchers to reflect infrastructure or demographic conditions that affect a solution’s adoption. Examples include median income, population density, or the percentage of land area devoted to croplands or forests. These maps also include data for different variables that can be chosen from the menu in the upper right.
Together, these visualizations help users spot opportunities and gaps, track equity indicators, and support data-informed decision making at the local level.
>> Visit the Drawdown Georgia Solutions Tracker now to start exploring the data.
The Intersection of Climate and Equity
The Drawdown Georgia Solutions Tracker also displays a Gini coefficient for each solution in the lower left corner of the screen. Developed by Italian statistician and sociologist Corrado Gini, the Gini coefficient measures inequality within a given group.
It ranges from 0 to 1, where 0 means complete equality (everyone shares the benefits equally) and 1 means complete inequality (one person has all the benefits, and everyone else has none). A lower Gini coefficient suggests a more equal distribution of benefits, while a higher one indicates greater inequality.
In the Solutions Tracker, you might notice that LED light bulbs, which are widely available, relatively inexpensive, and help homeowners and renters alike save on their energy bills, have a Gini coefficient of 0.09. On the other hand, rooftop solar, which requires a large upfront investment, has a Gini coefficient of 0.9, showing significantly higher inequality.
Why It Matters for Policymakers and Business Leaders
The Solutions Tracker addresses some of the most pressing questions local leaders face:
-
Where are cost-effective solutions already gaining traction?
-
Which communities could benefit most from additional support or infrastructure?
-
How can we design climate programs that improve equity and deliver co-benefits like public health, job creation, and resilience?
For policymakers, the Solutions Tracker provides clear, local data to inform grant proposals, zoning changes, infrastructure planning, and comprehensive climate action plans.
For business leaders, it reveals where sustainable practices—like energy-efficient retrofits or electrified transportation—are creating market momentum, opening the door for innovation, partnerships, and new customer bases.
Bright Spots: Georgia’s Climate Progress in Action
The Tracker and accompanying Solutions Report highlight Georgia’s top-performing climate solutions and the counties leading the way.
1. Large-Scale Solar: A Rural Success Story
-
Uptake: Georgia has deployed more than 4.1 GW of large-scale solar, far exceeding projections. Our state now ranks 5th in the nation for solar installations and 2nd for solar manufacturing.
-
Where it’s happening: Rural counties like Jones and Floyd are key contributors. The Hammond battery energy storage system (BESS) project in Floyd County is helping to optimize solar grid use in our state.
-
Co-benefits: Job creation, cleaner air, and grid modernization.
2. Energy-Efficient Cars: Market Momentum
-
Uptake: Strong, driven by improved fuel economy standards and public interest in increased fuel efficiency.
-
Technological advancements: Newer energy-efficient cars may incorporate advanced technologies including stop-start systems that reduce idling, direct injection engines, and plug-in hybrid functionality.
-
Co-benefits: Up to $600 in annual fuel savings per vehicle and improved air quality.
3. Demand Response: Grid Resilience with Equity Potential
-
Uptake: Over 335,000 Georgia households are enrolled in demand response programs.
-
Where it’s happening: The highest levels of adoption are concentrated in the suburbs and exurbs of the Atlanta metro area, particularly in regions served by electric membership cooperatives such as Snapping Shoals and Sawnee.
-
Co-benefits: Reduces peak load stress, improves air quality, and benefits all ratepayers.
4. Retrofitting Homes: A Win for Equity
-
Uptake: Accelerating with federal rebates and incentives. Example: Georgia’s Home Energy Rebates program offers up to $14,000 to homeowners making certain energy-saving retrofits.
-
Equity lens: LED and insulation adoption show Gini coefficients under 0.15—extremely equitable.
-
Co-benefits: Improved home comfort, savings on utility bills, and job growth in the energy retrofit sector.
5. Recycling: Widely Adopted and Industry-Backed
-
Uptake: More than 54% of residents participate regularly; recycling is considered one of the most widely adopted and equitable climate solutions in the state.
-
Business impact: Over 120 Georgia manufacturers use recovered materials, from paper pulp to carpeting.
-
Co-Benefits: Reduced waste sent to landfills, circular economy development, local manufacturing opportunities.
Viewing Climate Solutions Through an Equity Lens
The Solutions Tracker doesn't just show where solutions are scaling—it also highlights areas of inequity that can be improved on, especially in historically underinvested communities.
For example:
-
Community solar access remains limited, with a Gini coefficient of 0.90, indicating high inequality.
-
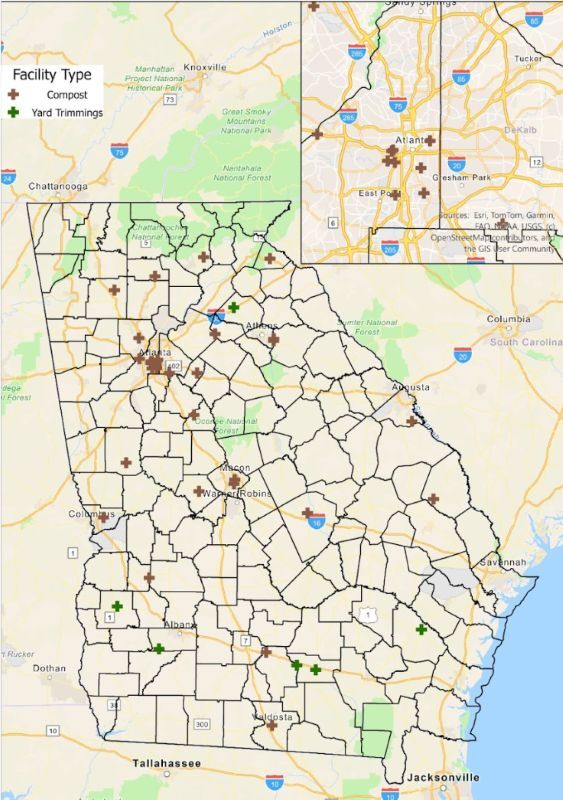
Composting infrastructure is more common in wealthier areas, though programs like CompostNow are helping close the gap.
-
Electric vehicle adoption is rising but remains concentrated in higher-income zip codes.
These disparities present opportunities for targeted, inclusive investments and public-private partnerships that will help bring climate solutions home to all Georgians.
Start Tracking Georgia’s Climate Progress Today
Whether you’re setting a county-wide sustainability target, planning your city’s next infrastructure investment, or looking for ways your company can lead on clean energy—the Solutions Tracker equips you with the data to act.
This is more than a tool. It’s a lens into Georgia’s climate future—and a guide to making sure that future is equitable, sustainable, and full of opportunity.