
Two Georgia counties can use similar amounts of electricity while producing very different levels of greenhouse gas emissions.
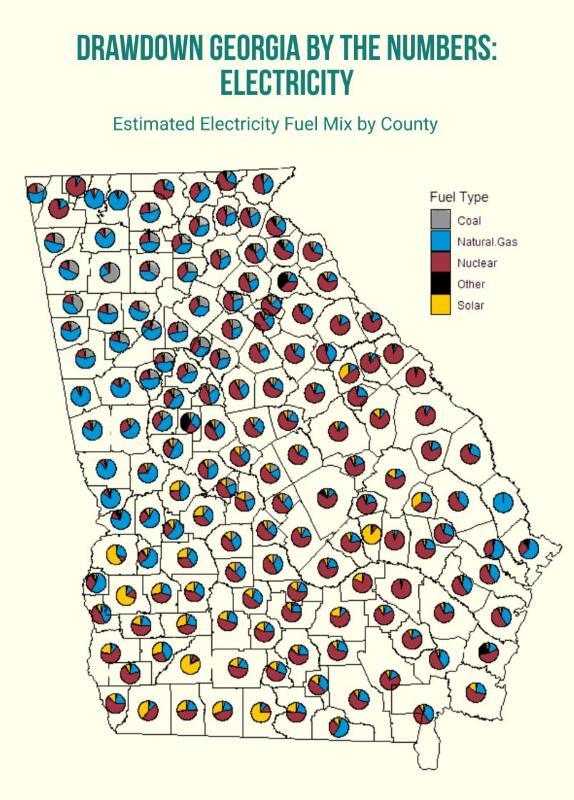
Some Georgia communities receive a larger share of electricity generated by nuclear or solar facilities. Others rely more heavily on natural gas or coal-fired power plants. Those differences affect the carbon intensity of local electricity and shape the emissions connected to homes, businesses, and industry.
Now, Drawdown Georgia is making that information easier to access through a new free quarterly subscription called Drawdown Georgia by the Numbers: Electricity.
 The new reports provide county-level estimates of electricity consumption, electricity-related greenhouse gas emissions, fuel mix, and the power plants supplying electricity to communities across Georgia. They are designed to help business leaders, policymakers, planners, sustainability professionals, and engaged community members better understand how Georgia’s electricity landscape is evolving over time.
The electricity reports are a companion to the existing free quarterly Drawdown Georgia by the Numbers county-level emissions updates, which track emissions across all sectors statewide.
What makes these electricity reports different?
Traditional electricity emissions estimates are often calculated across very large regions, averaging emissions across broad utility control areas. The new Drawdown Georgia by the Numbers: Electricity reports instead use a Georgia-specific modeling approach developed by Georgia Tech researchers to estimate electricity flows between individual power plants and counties.
That means subscribers can see:
-
Which power plants provide the largest share of electricity to their county
-
How much greenhouse gas pollution is associated with that electricity
-
How their county’s electricity fuel mix compares to the statewide average
-
How electricity patterns shift seasonally and over time
Each report includes maps, fuel mix visualizations, emissions comparisons, and detailed county-level estimates.
Why does localized electricity data matter for Georgia business leaders?
Many businesses today are working to better understand and reduce their operational emissions, including Scope 2 emissions tied to purchased electricity.
According to Georgia Tech researcher Bill Drummond, who led the creation of the electricity emissions reports, the localized nature of these reports can provide a more nuanced understanding of electricity emissions than broader regional averages.
“For companies that may be in areas that are close to solar or close to nuclear,” Drummond explains, “they will turn out to have significantly lower electricity emissions than calculated by the average across the entire control area.”
For Georgia business leaders, that information can support:
-
Sustainability and ESG reporting
-
Facility planning and siting decisions
-
Energy procurement conversations
-
Internal emissions reduction strategies
-
Long-term operational planning
The reports also provide valuable context for businesses looking to understand how Georgia’s electricity mix is changing as solar generation grows and new energy infrastructure comes online.
>>Learn more about solar and other renewable energy sources as climate solutions in Georgia.
How can policymakers and local leaders use this information?
For policymakers, local governments, and economic development leaders, electricity data can help inform conversations about growth, infrastructure, resilience, and energy planning.
The reports highlight how electricity generation varies across Georgia and how local decisions can influence future emissions outcomes. Drummond notes that some South Georgia counties already receive a majority of their electricity from solar generation during certain periods.
That creates opportunities for communities to better understand:
-
Local renewable energy development
-
Economic impacts of energy infrastructure
-
Community solar opportunities
-
Electricity demand trends
-
Regional differences in emissions intensity
The reports may also help local leaders identify opportunities to support climate solutions that work for Georgia, including large-scale solar, rooftop solar, and demand response initiatives.
Why are the reports organized seasonally?
Electricity generation and consumption are constantly changing throughout the year.
Solar production tends to peak during summer months when sunlight is strongest, while electricity demand patterns are shifting as more Georgians rely on electric heating during the winter.
To help users better understand these patterns, the reports are delivered quarterly using seasonal groupings of months.
This seasonal approach allows subscribers to track:
-
Changes in solar generation throughout the year
-
Shifts in electricity demand
-
Changes in the local electricity fuel mix
-
Longer-term trends in Georgia’s electricity system
Over time, these updates will help create a clearer picture of how Georgia’s electricity sector continues to evolve.
What will subscribers actually receive?
Four times a year, subscribers will receive free seasonal county-level electricity emissions reports tailored to their selected Georgia county.
Each report includes:
-
County electricity consumption estimates
-
Electricity-related greenhouse gas emissions estimates
-
County-to-state comparisons
-
Electricity fuel mix data
-
Information about the major power plants supplying local electricity
-
Visual maps and charts showing regional electricity patterns
Subscribers can also choose to receive the broader Drawdown Georgia by the Numbers updates that track emissions across all sectors statewide.
Together, the two reports provide a more complete picture of greenhouse gas emissions trends across Georgia communities.
Why is Drawdown Georgia investing in local emissions data?
One of Drawdown Georgia’s core goals is to help communities, businesses, and leaders access practical, Georgia-specific climate data to support informed decision-making around reducing GHG emissions.
Localized data helps communities move beyond generalized assumptions and better understand the opportunities and challenges specific to their region.
The electricity reports also reinforce a broader reality about Georgia’s energy future: different parts of the state are experiencing the transition to lower-carbon electricity in different ways. Tracking those changes over time can help leaders better understand where progress is happening and where additional opportunities may exist.
As Georgia continues to grow, access to reliable local data will become increasingly important for infrastructure planning, sustainability strategies, economic development, and emissions reduction efforts.
Subscribe to Drawdown Georgia by the Numbers: Electricity
Drawdown Georgia by the Numbers: Electricity is now available as a free quarterly subscription for all 159 Georgia counties.
Subscribe today to start receiving free quarterly electricity emissions updates for your county.