
The Justice40 Initiative is a new federal effort that aims to invest in equitable climate solutions across the country. Let’s take a closer look at this initiative and what it could mean for communities in Georgia.
Drawdown Georgia, Climate Solutions & Climate Justice
Drawdown Georgia’s central mission is to create a framework that helps the state reach the goal of net zero greenhouse gas emissions. But as we draw down emissions through a range of climate solutions, we also need to ensure that those solutions lift people up, that all communities are at the table, and that solutions deliver benefits to those who are under-resourced.
In the best circumstances, scaling climate solutions using equity as our compass reduces emissions to the benefit of all Georgians while also going beyond carbon to improve our economy, public health, and the larger environment.
Comparing the findings of a new federal screening tool that seeks to identify the communities across our country most impacted by environmental injustices with other climate data resources shows that scaling climate solutions, such as electric vehicles and large-scale solar, in our state can both reduce greenhouse gas emissions and improve equity.
First Steps Toward Taking Action on Climate Equity: the Justice40 Initiative
A few days after taking office in January 2020, President Biden signed Executive Order 14008. This order established the Justice40 Initiative, which sets a goal of directing 40% of certain federal investments toward communities disadvantaged by excessive burdens from a history of pollution, climate change, or other environmental hazards.
But how would the government determine which communities would be classified as disadvantaged?
Identifying Communities for the Justice40 Initiative
Last month the White House released version 1.0 of the Climate and Economic Justice Screening Tool (CEJST). The screening tool uses census tract boundaries to identify individual communities that could qualify for Justice40 funding.
What Determines a Disadvantaged Community?
The Tool screens for communities that have a median income at or below 200% of the federal poverty level. It also establishes eight primary factors to identify disadvantaged communities, including burdens from climate change, energy, health, housing, legacy pollution, transportation, water and wastewater, and workforce development.
In other words, if a community is both lower-income and qualifies in one or more of the eight areas listed above, it is characterized as disadvantaged for the Justice40 Initiative.
Locating Disadvantaged Communities
The CEJST website provides an interactive map that allows users to view where disadvantaged communities across the U.S. are located.
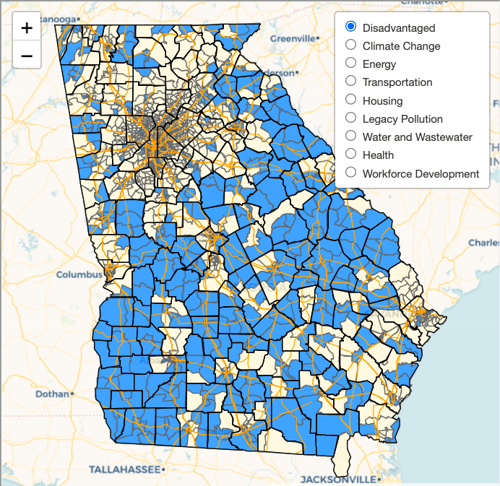
Figure 1: CEJST Disadvantaged population percentages by burden
Source: Data from Climate and Economic Justice Screening Tool
To obtain more in-depth information for Georgia, this interactive map shows lower-income communities, plus eight additional layers showing those impacted by each of the eight specific categories of burden.
Advancing Climate Solutions and Equity in Georgia
Drawdown Georgia’s 20 recommended climate solutions can significantly reduce greenhouse gas emissions, benefiting everyone in Georgia, the U.S., and the world. But, at the same time, implementing those solutions can have different local impacts in different communities. We need to ensure that, to the greatest extent possible, in fighting climate change we lift up all Georgians and don’t inadvertently harm communities that are already substantially disadvantaged.
Using the new Justice40 screening tool, we consider the equity benefits of two Drawdown Georgia climate solutions: electric vehicles and large-scale solar.
How Does Air Pollution From Cars & Trucks Impact Disadvantaged Communities in Georgia?
The new Justice40 screening tool provides census tract information for three measures related to air pollution from the transportation sector: traffic proximity and volume, diesel particulates, and fine particulate matter. (There’s some overlap between the three categories.)
Traditional vehicles are powered by internal-combustion engines, which run by burning gasoline or diesel fuel. When these fossil fuels are burned, they release not only CO2 but a number of other air pollutants that cause asthma, cancer, and birth defects, with children suffering the worst effects because their lungs are still developing. These pollutants include particulate matter and fine particulate matter.
The maps below display these three measures for census tracts across Georgia.
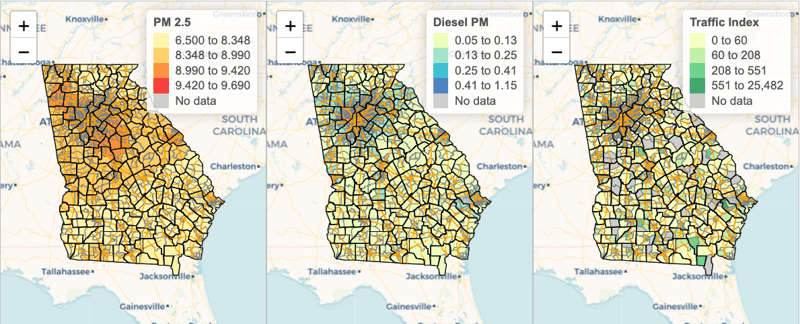
Figure 2: Three air pollution measures: fine particulate matter, diesel particulates, and traffic proximity
and volume index
Source: Data from Climate and Economic Justice Screening Tool
Electric vehicles, on the other hand, have no tailpipes and emit no direct emissions. EVs in Georgia also emit almost 70% fewer GHG emissions annually compared to gasoline vehicles. For a quick equity analysis of the public health benefits associated with electric vehicles, we can use additional data from the CEJST tool to compare fossil fuel air pollution values for disadvantaged vs. non-disadvantaged communities in Georgia. Table 2 shows the average values (weighted by population) for the three facets of air quality mapped above.
|
Tract Status |
Traffic Proximity |
Diesel Particulates |
Particulate Matter 2.5 |
| Not Disadvantaged | 603.86 | 0.27 | 8.62 |
| Disadvantaged | 866.89 | 0.32 | 8.97 |
| Disadvantaged Increase | 44% | 17% | 4% |
Table 2: Air quality comparison of tract population-weighted means
Source: Data from Climate and Economic Justice Screening Tool; calculations by Bill Drummond
As the chart shows, disadvantaged communities in Georgia are exposed to more air pollution from traffic proximity, diesel particulates, and fine particulate matter. Since electric vehicles will reduce both CO2 and other air-pollution-causing emissions, this climate can help improve public health in disadvantaged communities, which are disproportionately impacted.
How Much Does Utility-Scale Solar Benefit Georgians?
Our second quick equity analysis considers the benefits of increasing large-scale solar. The Drawdown Georgia Research Team has found that large-scale solar is the climate solution that can achieve the largest level of greenhouse gas reductions by 2030.
But will the development of many, many acres of solar farms help or hurt the local communities in which the facilities are located? This is a complicated question. But in terms of purely economic benefits, local communities will, on balance, benefit from large-scale solar because:
-
Georgia is a big state and has a large amount of land suitable for large-scale solar;
-
With lots of land available, solar farms have been in the past and will be in the future targeted to scrubland, barren land, abandoned cropland, and land without significant environmental limitations;
-
Construction and maintenance of solar farms will provide increased employment opportunities, especially during construction; and
-
The local property tax base for schools and other government services will expand as marginal land with little economic value is transformed into land producing thousands of dollars of electricity per acre per year.
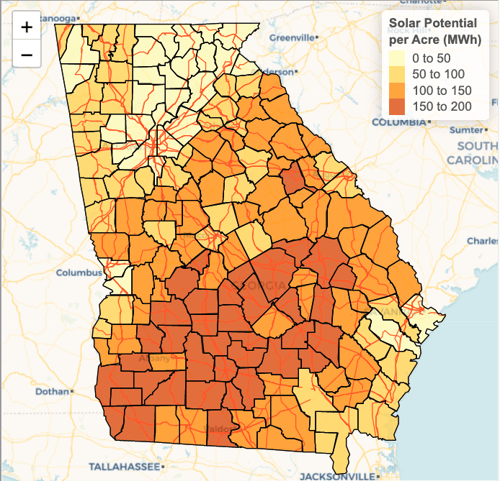
Figure 3: Utility-scale solar annual potential output in MWh
Source: Data from National Renewable Energy Laboratory SLOPE Tool
Figure 3 is a map showing the utility-scale solar potential for Georgia counties. The units are annual MWh of energy that could be produced per acre of land in solar farms. The data behind the map was produced by the National Renewable Energy Laboratory (NREL) using the lab’s Renewable Energy Potential Model.
Using the data behind the map we can classify Georgia counties into four tiers of solar potential. Tier 1 (150-200 annual MWh per acre) is the darkest shade and the most productive, while Tier 4 (0-50 MWh per acre) is the lightest and least productive. For each tier we then calculate the percentage of the population living in disadvantaged communities, resulting in Table 3.
|
County Tiers for Large-Scale Solar Potential |
Disadvantaged Population |
Total Population |
Disadvantaged Percent of Total |
| 1: highest PV potential | 518,819 | 692,793 | 74.9% |
| 2: higher PV potential | 741,627 | 1,537,529 | 48.2% |
| 3: lower PV potential | 793,049 | 2,514,950 | 31.5% |
| 4: lowest PV potential | 1,511,961 | 5,658,575 | 26.7% |
Table 3: Comparison of four tiers of large-scale solar potential
Source: Data from Climate and Economic Justice Screening Tool and
National Renewable Energy Laboratory SLOPE Tool; calculations by Bill Drummond
The differences between the tiers are striking. In the best utility-scale solar locations nearly 3 out of 4 people live in disadvantaged communities, while in the bottom-tier locations only about 1 out of 4 people are in disadvantaged communities.
As long as the local benefits of utility-scale solar outweigh its shortcomings, the replacement of fossil fuel power generation with zero-carbon solar produces a double-win for equity: reduction of air pollution that disproportionately affects disadvantaged communities and economic benefits of solar farms that disproportionately benefit disadvantaged communities.
Leveraging Data and the Justice40 Initiative to Advance Climate Justice
Focusing on equity is important as nearly $1 trillion in funding is distributed from new federal laws, the Bipartisan Infrastructure Law, and the Inflation Reduction Act. Executive Order 14008 and the Justice40 initiative set a target of nearly $400 billion in funding to directly benefit disadvantaged communities.
Taking a close look at the data around local air pollution and large-scale solar potential, one can conclude that reduced use of fossil fuels combined with increased adoption of electric cars and development of solar farms will have positive impacts on disadvantaged communities that need them the most.
Track Emissions Progress at the Local Level
Drawdown Georgia by the Numbers county emissions updates are a convenient new tool that gives those working at the local level unprecedented access to local climate data that you can use to manage and measure emissions.
Emailed straight to your inbox on a quarterly basis, these updates are an invaluable resource to anyone working on climate in our state. Let’s take a closer look at this new way of tracking emissions in Georgia.
![]()