When communities make decisions about roads, buildings, farms, or energy systems, they’re making investments that will last for decades. But too often, those decisions rely on data that reflects the past—not the conditions those systems will face in the future.
That’s where the new Drawdown Georgia Climate Outlook Maps come in.
This new resource offers a clear, accessible way to explore how Georgia’s climate could shift between now and 2050, and what those changes could mean for infrastructure, agriculture, public health, and economic development.
By translating complex climate science into Georgia-specific visuals, the maps give leaders across the state a practical tool to support long-term planning and strengthen resilience.
Turning Global Climate Science into a Tool for Local Decision-Making
Developed by Georgia Tech researcher Dr. William Drummond, the maps take global climate models used in federal assessments and translate them into localized projections for Georgia.

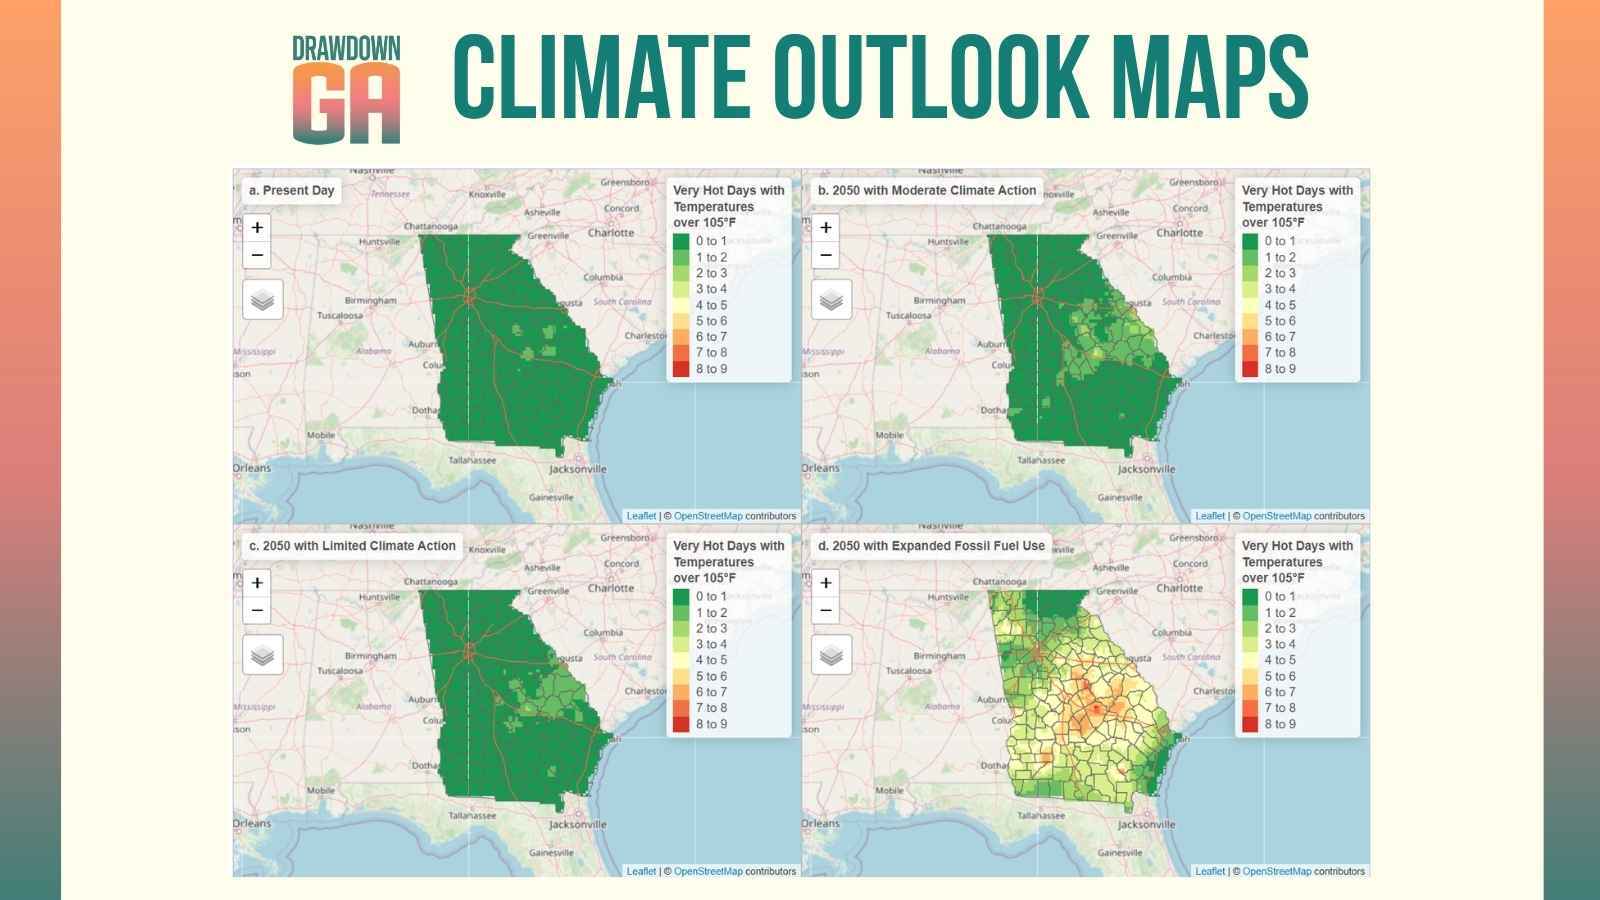
The result is a set of interactive maps that allow users to compare present day climate conditions with projected conditions in 2050 across three different emissions pathways.
This localized approach matters. Georgia’s diverse geography—from coastal regions to agricultural areas to urban centers—means climate impacts won’t look the same everywhere.
The Drawdown Georgia Climate Outlook Maps focus on 2050: a time horizon that aligns with how communities plan. Infrastructure built today will still be in use for decades, so understanding future conditions helps ensure investments are designed to perform over time. That makes the maps especially useful for capital planning, land use, and long-term economic development.
Understanding the Scenarios Behind the Maps
One of the most powerful features of the Climate Outlook Maps is the ability to compare multiple possible futures.
Each set of maps includes three emissions scenarios:
-
Moderate climate action: emissions level off and begin to decline
-
Limited climate action: emissions continue rising at a slower pace
-
Increased fossil fuel use: emissions rise significantly
These scenarios are based on widely used global frameworks known as Shared Socioeconomic Pathways (SSPs), developed by the Intergovernmental Panel on Climate Change.
Each map illustrates how different global choices—about energy, technology, and economic development—could shape future climate conditions.

As shown in the global emissions pathways chart above, the differences between these scenarios are significant. Under higher-emissions pathways, global CO₂ output could increase substantially by 2050, while more moderate pathways show emissions stabilizing or declining.
Seeing these scenarios side by side helps users understand not only what may happen, but how different pathways could lead to different outcomes for Georgia.
What the Maps Show About Georgia’s Future Conditions
Across scenarios, the maps highlight several trends that are especially relevant for Georgia:
-
More extreme heat: an increase in very hot days, particularly under higher-emissions pathways
-
Changes in rainfall patterns: including shifts in heavy precipitation that can affect flooding and stormwater systems
-
Impacts on agriculture: changes in growing seasons and temperature conditions that affect crops and land use
-
Regional variation: different parts of the state experiencing different levels of change
These projections align with broader trends observed across the Southeastern United States, where rising temperatures, heavier rainfall events, and climate-related health impacts are expected to become more pronounced over time.
Importantly, the maps are designed to support planning—not to predict specific events. Climate models provide scenario-based estimates of long-term trends, helping communities prepare for a range of possible conditions rather than a single outcome.
How Different Georgia Audiences Can Use the Maps
One of the strengths of the Climate Outlook Maps is their versatility. Whether you’re making policy decisions, running a business, leading a community initiative, or simply interested in Georgia’s future, the maps offer practical insights you can apply.
For policymakers and planners
Local and state leaders can use the maps to inform infrastructure investments, land use planning, and public safety strategies.
For example, understanding where extreme heat is projected to increase can help guide investments in cooling centers, building standards, or urban tree canopy. Insights into changing rainfall patterns can support stormwater planning and flood mitigation efforts.
Access to localized, scenario-based data also helps policymakers communicate clearly with constituents and build support for resilience-focused investments.
For business leaders
For businesses, the maps offer a way to assess long-term risk and opportunity.
Companies can use the projections to evaluate facility locations, supply chain resilience, workforce safety, and operational costs tied to energy and weather conditions. For industries like agriculture, logistics, and manufacturing, understanding how conditions may shift across regions can inform both near-term decisions and long-term strategy.
These insights support more informed investments while helping businesses stay competitive in a changing environment.
For community and faith leaders
Community leaders and local organizations can use the maps to guide outreach, preparedness, and equity-focused initiatives.
By understanding how climate impacts may vary across regions, leaders can better identify vulnerable populations, design targeted programs, and advocate for resources that support community resilience.
The maps can also serve as an educational tool that helps translate complex climate information into visuals that are easier to share and discuss within communities.
For every Georgian
For individuals and households, the maps offer a way to better understand what climate trends could mean close to home.
Whether you’re thinking about home improvements, energy use, or how your community may change over time, the maps provide context that can help guide everyday decisions.
They also reinforce a broader point: the choices we make today—at every level—play a role in shaping the future conditions we see in these scenarios.
Part of a Growing Set of Tools to Support Climate Solutions in Georgia
The Climate Outlook Maps are part of Drawdown Georgia’s broader effort to equip communities with the data and tools they need to take action.
While tools like the Greenhouse Gas Emissions Trackers and Solutions Tracker help measure progress and identify opportunities to reduce emissions, the Climate Outlook Maps focus on another critical piece of the puzzle: preparing for the changes already underway.
Together, these resources support a more complete approach that can help Georgia communities both reduce emissions and plan for resilience in the decades ahead.
Explore the Maps and Start Planning for What’s Ahead
The future isn’t set, but it is taking shape based on the choices we make today.
The Drawdown Georgia Climate Outlook Maps offer a clear, accessible way to explore those possibilities and use them to inform decisions that matter for Georgia’s communities, economy, and environment.
Explore the maps to see how conditions may change in your region—and how you can help build a more resilient future for Georgia.