Every hour of every day, greenhouse gasses (GHGs) are released into the atmosphere. It’s easy to forget that our everyday actions create these emissions because the GHGs produced by generating electricity are released many miles away from our homes and workplaces where the electricity is consumed. But what if we could see and feel GHGs? Would it impact our behaviors, the choices we make, or the actions we take to solve for climate change? Better understanding emissions at the local level is one of the tools that can help us think differently about those solutions.
Tracking Greenhouse Gas Emissions in Georgia
Our first step is consulting the Drawdown Georgia GHG Emissions Tracker where we will see something like the image below. The default data represents the entire state, but with a few clicks, you can localize it. I recommend clicking on the double arrow (circle 1) to maximize the Tracker screen. Then click on the central map’s county of your choice (circle 2). I’m clicking on Bibb County (city of Macon), which is near the geographic center of Georgia.
![]() Statewide GHG Emissions
Statewide GHG Emissions
After you select a county, the others will fade slightly and all the numbers and charts on the screen will change to reflect values for your selected county rather than the entire state.
![]() Bibb County GHG Emissions
Bibb County GHG Emissions
Putting Greenhouse Gas Emissions in Context
There is a lot to explore in the Tracker; let’s focus on the four numbers in the upper right corner.
Net Emissions Per 1,000 People
Circle 1 above points to the value 1,197 metric tons, which is the estimated Bibb County net emissions per 1,000 people for December 2021. Net emissions refers to the amount of GHGs directly released into the atmosphere minus the amount of GHGs absorbed by urban trees and forests.
This number is valuable because it allows us to compare emissions between counties with different populations, and because it helps us personalize large climate change numbers that often run in the millions, billions, trillions, and even quadrillions.
Emissions Per Person
Circle 2 points to 2,639, the equivalent number in terms of pounds per person. To create a meaningful equivalent, you can round this number down to 2,500 and compare it to the weight of a typical full-size pickup truck, which is about 5,000 pounds.
Over a year, one person’s emissions at this level would equal the weight of 6 full-size pickup trucks!
Total Emissions
However, our atmosphere and climate don’t care about GHG emissions per person. They care about total emissions aggregated from every workplace, home, power plant, vehicle, and tree across the planet, and about how much of those emissions can be sequestered naturally or otherwise. Circle 3 points to Bibb County’s total emissions, again in metric tons.
The Tracker uses metric tons rather than pounds because climate change is a problem for the global community, and the countries of the world, including the United States, have agreed to use metric tons as the basic units for GHG emissions whether at the levels of persons, households, communities, nations, or the entire planet.
Annual Emissions
Finally, Circle 4 points to the annual total of emissions for all months up to and including the selected month shown in the upper left corner of the tracker.
You can change the Tracker to any month of any year (from 2005 onward) using the drop-down menus in the upper-left corner of the screen.
What Does a Metric Ton of Carbon Dioxide Look Like?
If one month’s emissions in a county total 1,197 metric tons per 1,000 people, simple math tells us that each person’s emissions are close to 1.2 metric tons. But it’s difficult, if not impossible, to imagine a metric ton of an odorless, colorless gas like carbon dioxide (CO2), the greenhouse gas that’s emitted whenever we burn coal, gasoline, natural gas, or any fossil fuel. If we could see CO2, what would it look like?
To find an example, let’s take a trip to our local grocery store. Just inside the entrance of my local store is a waist-high freezer decorated with a friendly, smiling penguin. Inside are plastic bags with blocks of dry ice.
 Solid CO2, or dry ice
Source: KarolinaHalatek, CC BY-SA 4.0, via Wikimedia Commons
These blocks of dry ice weigh a few pounds each, but what would a metric ton of dry ice look like? It happens that we can go to a baking-goods aisle in the grocery store and buy multiple packages of an item that is almost exactly the same mass per cubic inch as dry ice. In fact, if we were able to grind dry ice down to very, very small pieces, we would have granules with almost exactly the same weight and volume of common table sugar.
If the typical bag of table sugar weighs four pounds and there are 2,205 pounds in a metric ton, a little math tells us we would need to buy slightly more than 550 bags of sugar to yield one metric ton.
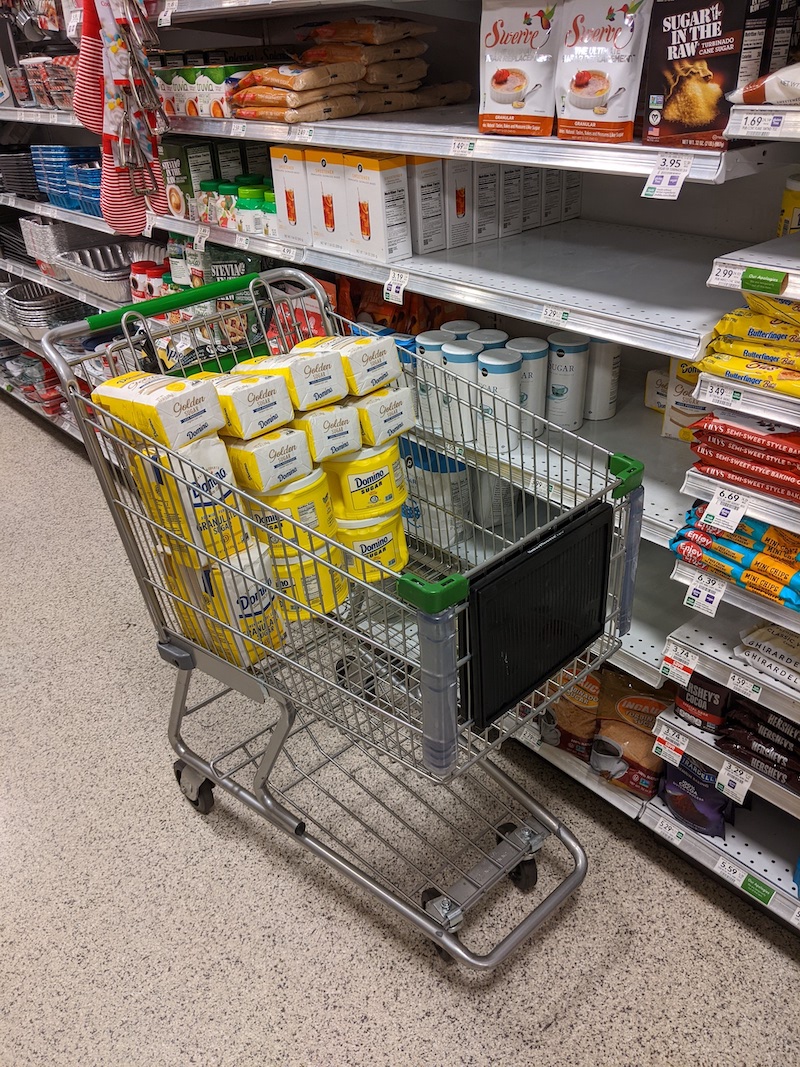
Through experimentation at my local grocery store, I estimate that a large shopping cart piled to the rim could hold up to 130 bags of sugar, so a person generating a metric ton of CO2 emissions per month is putting into the atmosphere the equivalent of four shopping carts full of sugar, or roughly one cartload per week.
 A shopping cart in the process of being filled with sugar
Calculating Your Carbon Footprint
What goes into this number, commonly called your carbon footprint?
You can use the EPA’s Carbon Footprint Calculator to see details about how different daily activities produce GHG emissions. But in general, driving four miles in an average gasoline-powered vehicle releases one four-pound bag of sugar worth of CO2 into the atmosphere, as does using your hair-dryer for four minutes each day for a month.
These activities are each small contributors to climate change, but when we start adding together all our GHG-producing activities, month after month, year after year, across all the people on the planet, it is not so surprising that our climate is changing.
>> What is a Megaton of Carbon?
Sources of Local Emissions
If you’d like more detail about the different sources of your local emissions, Circle 1 below points to a bar chart of emissions and forest uptake by sector, and Circle 2 highlights a group of buttons to take you to different screens with further details about electricity consumption, electricity generation, large facility direct emissions, agriculture emissions, and forestry carbon uptake.
![]() Details on emission sources
Details on emission sources
One final note: my example of Bibb County is somewhat unfair to the good people of Bibb County. Bibb County’s transportation emissions are especially high due to its central location at the junction of I-16 and I-75. That junction connects directly to the port of Savannah to the east, Atlanta to the north, and Florida to the south. Without the extra emissions from thru-traffic, I expect Bibb County residents’ emissions per person would be equal to or lower than the statewide average.
What Does the Drawdown Georgia GHG Emissions Tracker Say About Your Georgia County?
Click here to access the Drawdown Georgia GHG Emissions Tracker and take your own deep dive into the data to see where emissions come from in the places you live, work, and visit.