As we work collectively to draw down greenhouse gas emissions in Georgia, we can now track and visualize that progress.
![]()
Introducing a New Greenhouse Gas Emissions Tracking Tool
The new Drawdown Georgia GHG Emissions Tracker is a free, interactive tool that shows, for the first time, where greenhouse gas emissions come from in Georgia at the state and county level. This greenhouse gas emissions tracking resource was developed by Dr. William Drummond of Georgia Tech, along with colleagues at both Georgia Tech and University of Georgia.
As the old adage reminds us: If you can’t measure it, you can’t change it. So, what can you now measure?
GHG Emissions Tracker: Exploring the Data
![]()
The Tracker allows you to explore monthly and annual greenhouse gas emissions across our state. It provides carbon emissions reporting broken down by key sectors, such as transportation, electricity, industry, agriculture, and buildings. It also captures how much carbon dioxide is sequestered by forests in Georgia. All of this data will be updated regularly and more features will be added over time.
The GHG tracking information powering this tool comes from publicly available datasets, primarily from federal agencies such as the Department of Energy, the Department of Transportation, and the Environmental Protection Agency. Statewide emissions data is converted to county values using various local indicator variables, such as population and housing characteristics from the Census Bureau’s American Community Survey.
At the state level, you can see that in 2020 Georgia had a net carbon footprint of about 94 million metric tons of carbon dioxide equivalent (CO2e). This reflects the state’s total emissions minus the carbon sequestered by forests. Almost 60% of the land in Georgia is forested and those ecosystems sequester carbon in trees, other vegetation, and soil. In 2020, for example, forests sequestered about 41 million metric tons of carbon dioxide in the state.
This greenhouse gas emissions tracker shows that transportation is the largest source of emissions in Georgia, as cars and trucks burn petroleum-based fuels. Electricity follows close behind, with emissions coming primarily from coal- and gas-fired power plants. Electricity-sector emissions show up in the greenhouse gas footprints of our residential and commercial buildings. In addition, buildings’ carbon footprints reflect the natural gas used for heating and cooking. Industry and agriculture are also key sources of emissions in the state.
How to Track Greenhouse Gas Emissions at the County Level
By zooming in, the tracker allows you to see how each of Georgia’s 159 counties uniquely contributes to the state’s carbon footprint.
Some counties, such as Dekalb County, have lots of people and lots of cars. In 2020, Dekalb County emitted almost 8 million metric tons of CO2e. Transportation was the county’s largest source of emissions, followed by residential buildings, commercial buildings, and industry. Dekalb County has little forested land to contribute by sequestering these emissions.
![]()
Other counties, such as Rabun County, have lots of trees and relatively few people or industry. In 2020, you can see that the county actually had a negative carbon footprint, as forests in the county sequestered more carbon than was emitted that year.
The emissions profile looks different in counties like Macon County that have lots of agriculture and industry. Those two sectors were the top emitters in Macon County in 2020.
Interpreting GHG Tracking Data
It’s important to keep in mind that counties with relatively low total emissions or net-negative emissions, still produce greenhouse gases that impact our state’s carbon footprint. Reducing emissions in Georgia is everyone’s work. The Tracker shows average emissions per person. For example, in October 2021, Georgians released 667 metric tons of greenhouse gases for every 1,000 people in our state or about ⅔ of a metric ton per person.
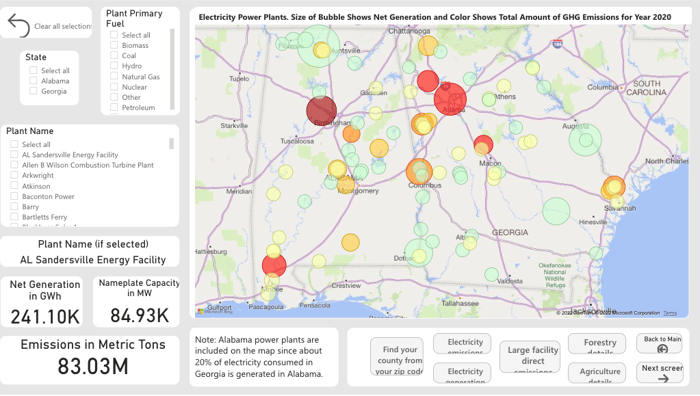
As you move to different screens, you can dig into specific areas of interest and learn more. For example, the Electricity Generation screen shows the annual greenhouse gas emissions for all of the power plants in both Georgia and Alabama. About 20% of the electricity consumed in our state is generated in Alabama. So, the carbon emissions associated with our electricity sector are closely tied to our neighbors to the west. Or you can toggle to the Large Emitter screen that maps all major industrial emitters. This allows you to see how industry contributes to our state and county emissions profiles.
Watch the Drawdown Georgia GHG Emissions Tracker in Action
You can watch the presentation announcing the launch of this one-of-a-kind carbon emissions reporting tool below.
Click here to access the Drawdown Georgia GHG Emissions Tracker and dive in to see where emissions come from in the places you live, work, and visit. And, then we hope you get to work, helping to draw down emissions in Georgia.